Figure 6.
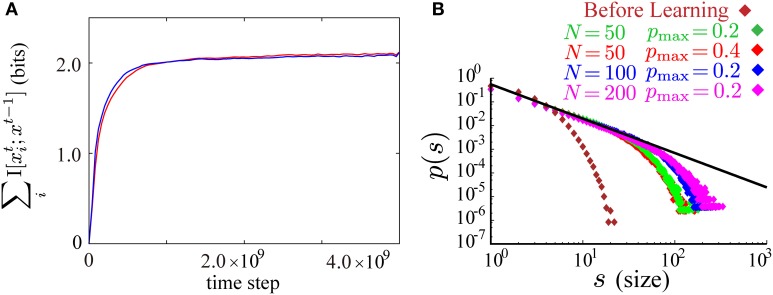
(A) Time evolution of the sum of the neuron-wise information terms ∑iI [xti; xt − 1] during the course of learning according to the objective function with the lower bound A1, Equation (9) (the red curve), and the modified objective function obtained by replacing A1 with A′1, Equation (10) (the blue curve). (B) The results in Figure 3B are reproduced after learning with the modified objective function and the same learning parameters as in Figure 3B. Log-log plots of size of bursts s against the occurrence of bursts of that size p(s) before (brown) and after learning (red for pmax = 0.4 and N = 50, green for pmax = 0.2 and N = 50, blue for pmax = 0.2 and N = 100, and magenta for pmax = 0.2 and N = 200). The size distributions after learning fall on the straight line of slope around −3/2 (the black line).

