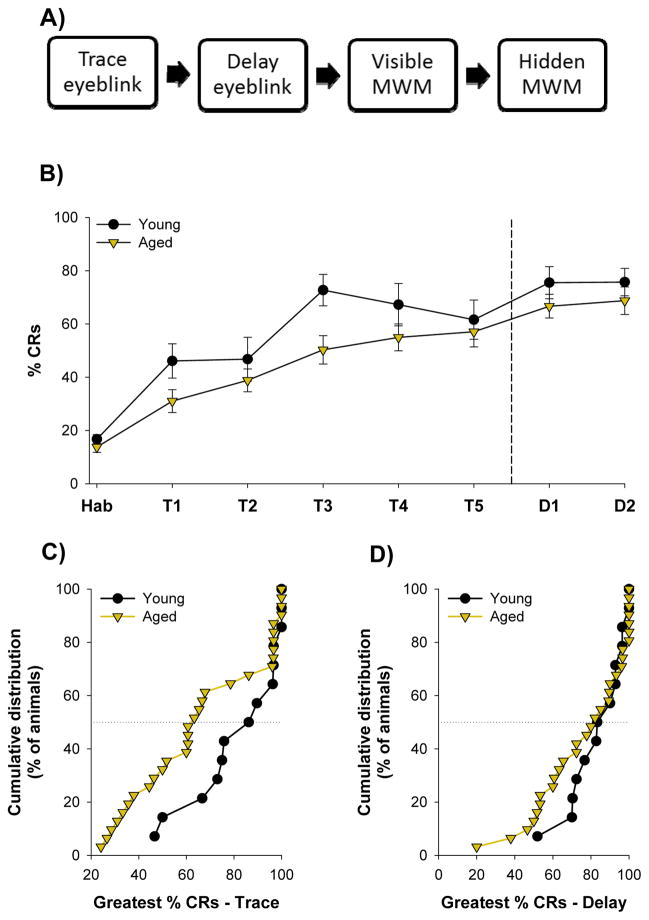
Figure 1.
A) Experimental design. All animals were trained with trace eyeblink conditioning followed by delay conditioning. They were then trained with the visible platform version of the Morris water maze, followed by the hidden platform version of the maze. Probe trials were conducted following the third, fourth, and fifth sessions of hidden platform training. B) Young (N=14) and aged (N=31) animals acquired the trace and then delay eyeblink responses. C) Cumulative distributions of the greatest %CRs emitted by each young and aged rat during any one session of trace conditioning. D) Cumulative distributions of the greatest %CRs emitted during any one session of delay conditioning. Vertical dashed line indicates transition from trace to delay conditioning. Horizontal dotted lines indicate median of cumulative distributions. Error bars represent standard error of the mean.

