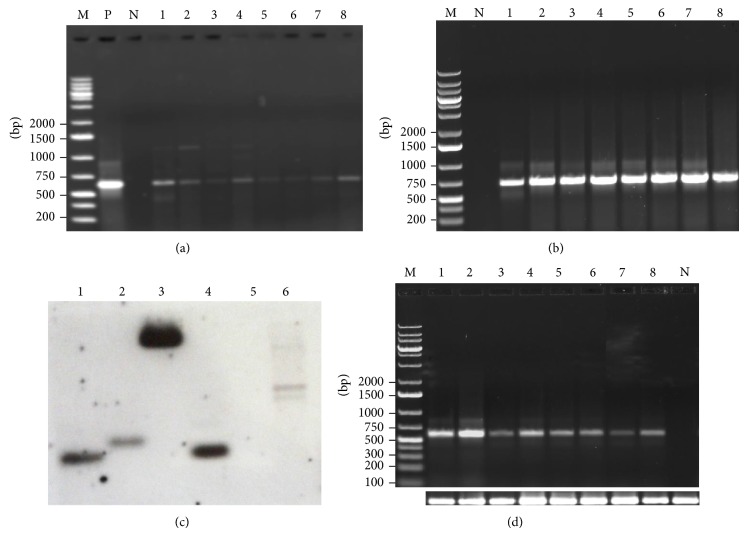
Figure 3.
Molecular characterization of mtlD peanut transformants. (a) PCR amplification using mtlD gene-specific primers (expected size 600 bp); (b) PCR amplification of transformants using nptII gene specific primers (expected size 750 bp), where lane N: negative control; lane P: positive control (pCAMBIA1380 plasmid DNA); and lanes 1–8: transgenic lines (MTD1 to MTD8); (c) Southern blot analysis of transgenic (T0) and nontransformed peanut lines. Where lanes 1–4: DNA from transgenic lines, lane 5: DNA from nontransformed line (cv. GG 20, −ve control), and lane 6: plasmid DNA (+ve control); (d) detection of mtlD gene transcription in transgenic plants using RT-PCR. Lane N = nontransformed line; lanes 1–8 = transgenic lines (MTD1 to MTD8), bottom row: 18SrRNA as internal control.

