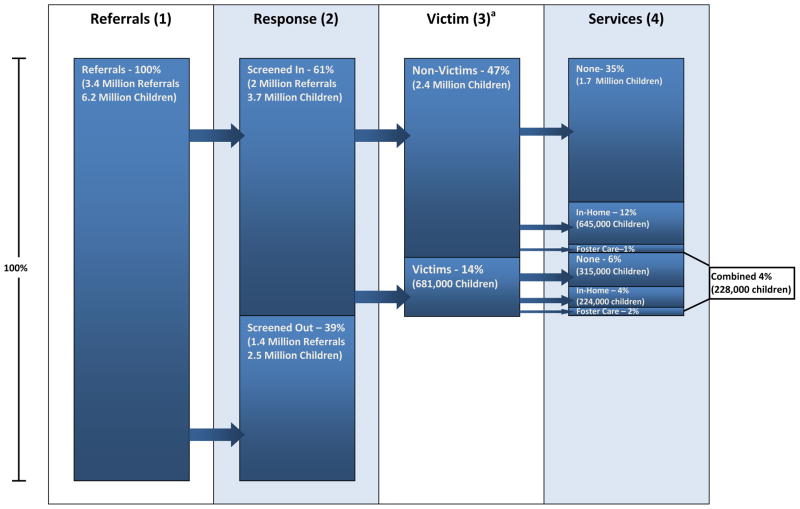
Figure 1. Flow of Children through Child Protective Services.
Note: Adapted from U.S. Department of Health and Human Services (2013:xi).
a All victim determinations refer to unique victims (meaning that each child could only be counted as a victim once). Referrals, response, and services all refer to duplicate children (meaning children could be counted more than once). Because of this, percentages calculated for Stage 3 and Stage 4 are approximations of the final share of the population included in these categories and are not equivalent to the number divided by 6.2 million.

