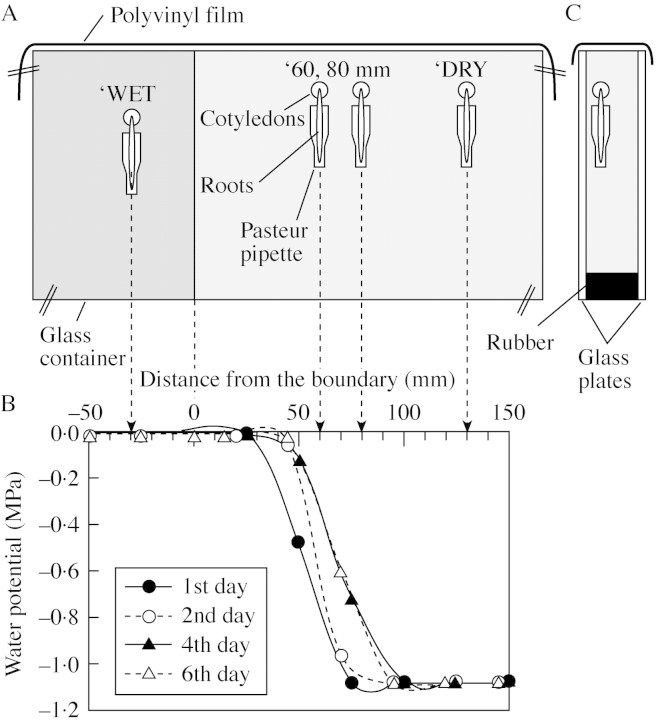
Fig. 1. A schematic representation of the glass container (500 × 500 × 25 mm) filled with vermiculite, showing seedlings in Pasteur pipettes (A and C) and the water potential in the vermiculite at various distances from the boundary between the wet and the dry vermiculite (B). A, About one‐third of the volume of the container was filled with wet vermiculite (dark shading), the rest with dry vermiculite (light shading). The top of the container was sealed with polyvinyl film to prevent evaporation. The original axis of each root was parallel to the boundary between the wet and the dry vermiculite. B, Positive and negative values for the distance from the boundary indicate the measurements in the dry and the wet vermiculite, respectively. A 20‐mm‐diameter cork borer was used to collect samples of vermiculite to determine water content. The water potential was calculated from the relationship between the water potential and the water content of the vermiculite, as noted in the text. C, A side view of the container. Seedlings were placed close to one of the glass plates for easy observation.

An official website of the United States government
Here's how you know
Official websites use .gov
A
.gov website belongs to an official
government organization in the United States.
Secure .gov websites use HTTPS
A lock (
) or https:// means you've safely
connected to the .gov website. Share sensitive
information only on official, secure websites.
