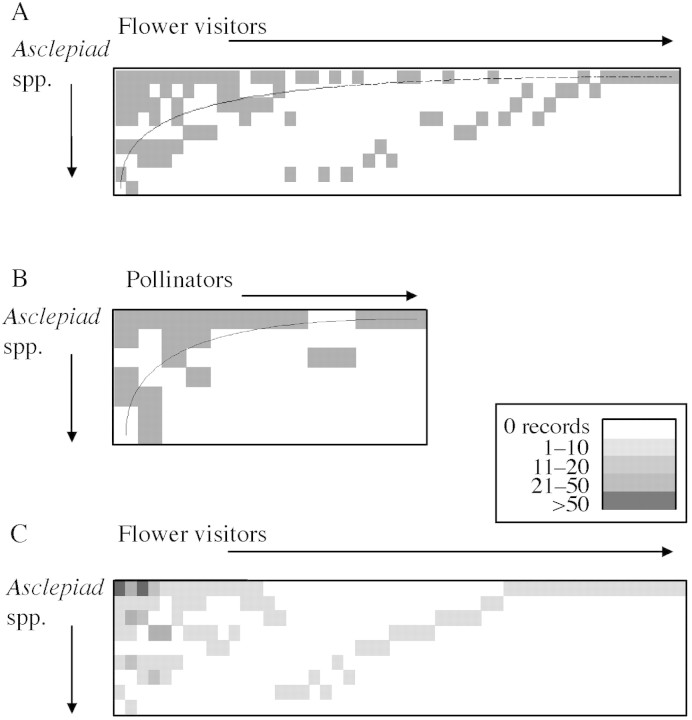
Fig. 4. Nestedness analyses of A, the flower visitor–plant interactions matrix; B, the pollinator–plant interaction matrix; C, the flower visitor–plant interactions matrix with abundance of insect species overlain. Note the legend. The matrix is identical to that in Fig. 4A except that the order of some insect species is different.

An official website of the United States government
Here's how you know
Official websites use .gov
A
.gov website belongs to an official
government organization in the United States.
Secure .gov websites use HTTPS
A lock (
) or https:// means you've safely
connected to the .gov website. Share sensitive
information only on official, secure websites.
