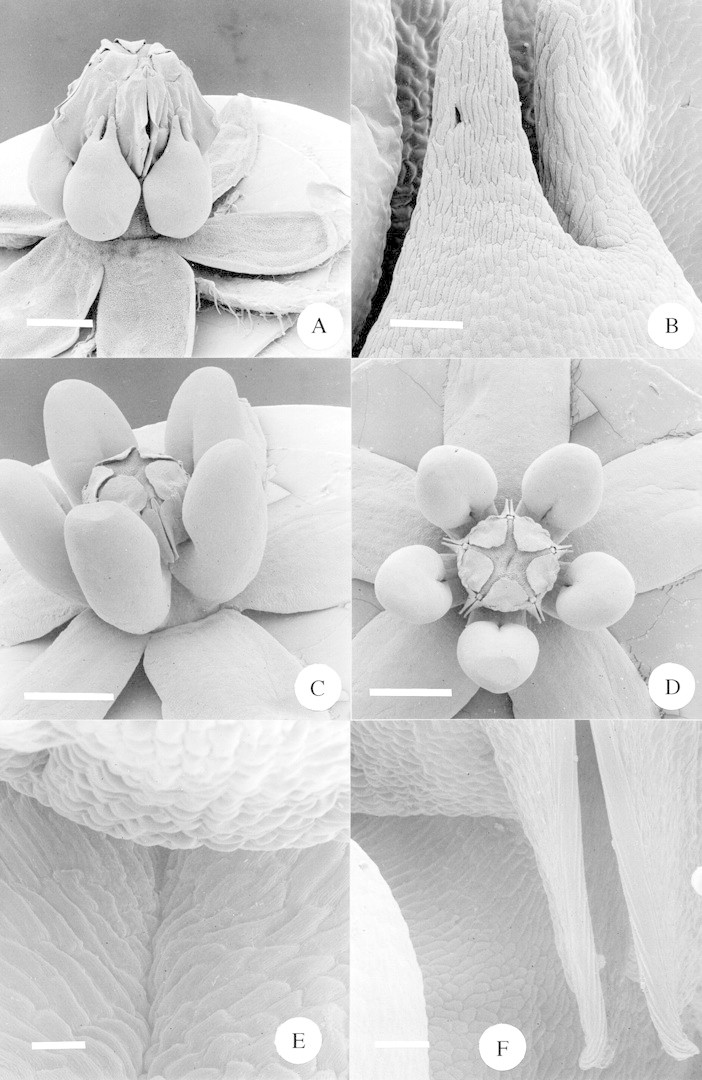
Fig. 7. A, SEM of whole flower of Xysmalobium involucratum. Scale bar = 1·0 mm. B, SEM close‐up of the top portion of the corona of Xysmalobium involucratum. Scale bar = 100 µm. C, SEM of whole flower of Xysmalobium gerrardii. Scale bar = 1·0 mm. D, SEM top view of whole flower of Xysmalobium gerrardii. Scale bar = 1·0 mm. E, SEM close‐up of Xysmalobium gerrardii, showing the space between the gynostegium (top of picture) and the inner surface of the corona (bottom of picture). Scale bar = 25 µm. F, SEM close‐up of Xysmalobium gerrardii, showing the region where the gynostegium and the corona meet, with the lower portion of the guide rails to the right. Scale bar = 50 µm.
