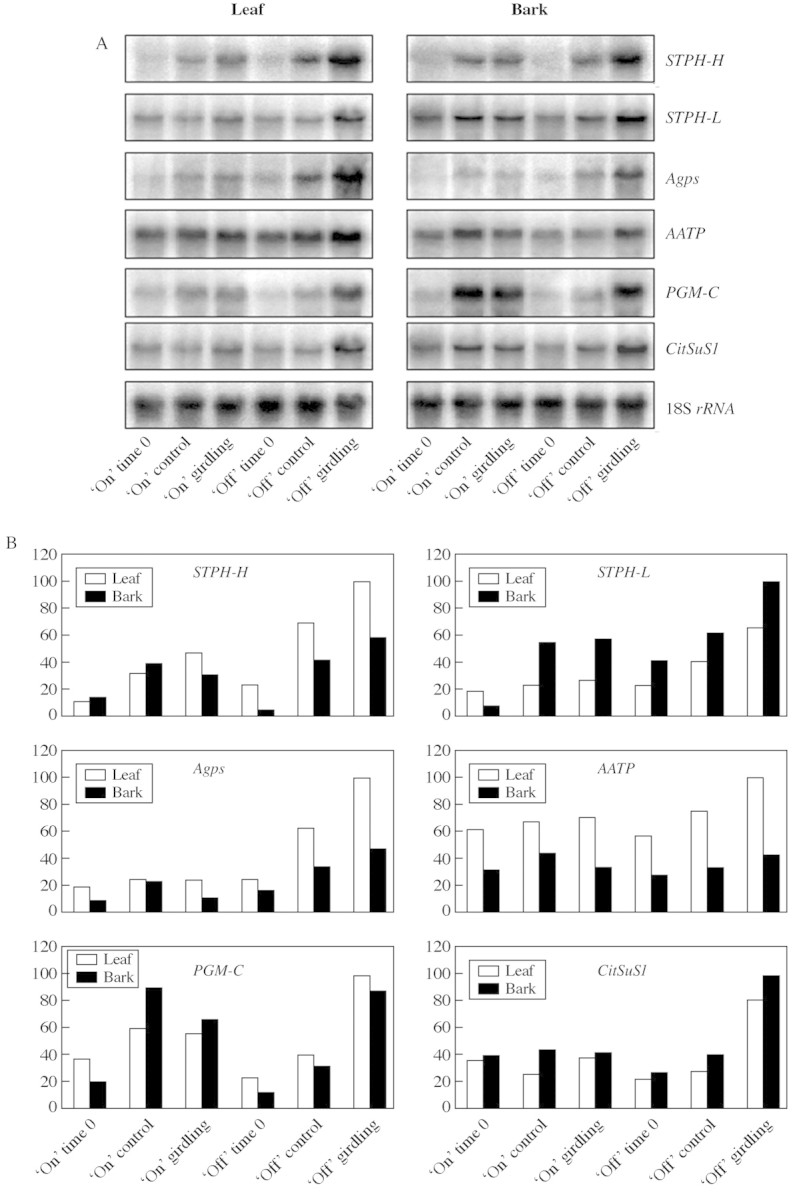
Fig. 3. Relative transcript levels of STPH‐H, STPH‐L, Agps, AATP, PGM‐C and CitSuS1 in leaves and bark of girdled and non‐girdled ‘on’ and ‘off’ citrus trees (A). Total RNAs (20 µg) isolated from leaves and bark were separated and analysed by RNA blot. 18S rRNA from citrus was used as an internal control for loading differences. Relative levels of transcripts (B) were estimated by quantitation of signals on the blotted membranes with a Phosphorimager BAS1000 (Fuji Photo Film, Tokyo, Japan). The results are expressed as a percentage of the respective maximum level for each gene. Results are representative data of two independent experiments, the same as for Fig. 5.
