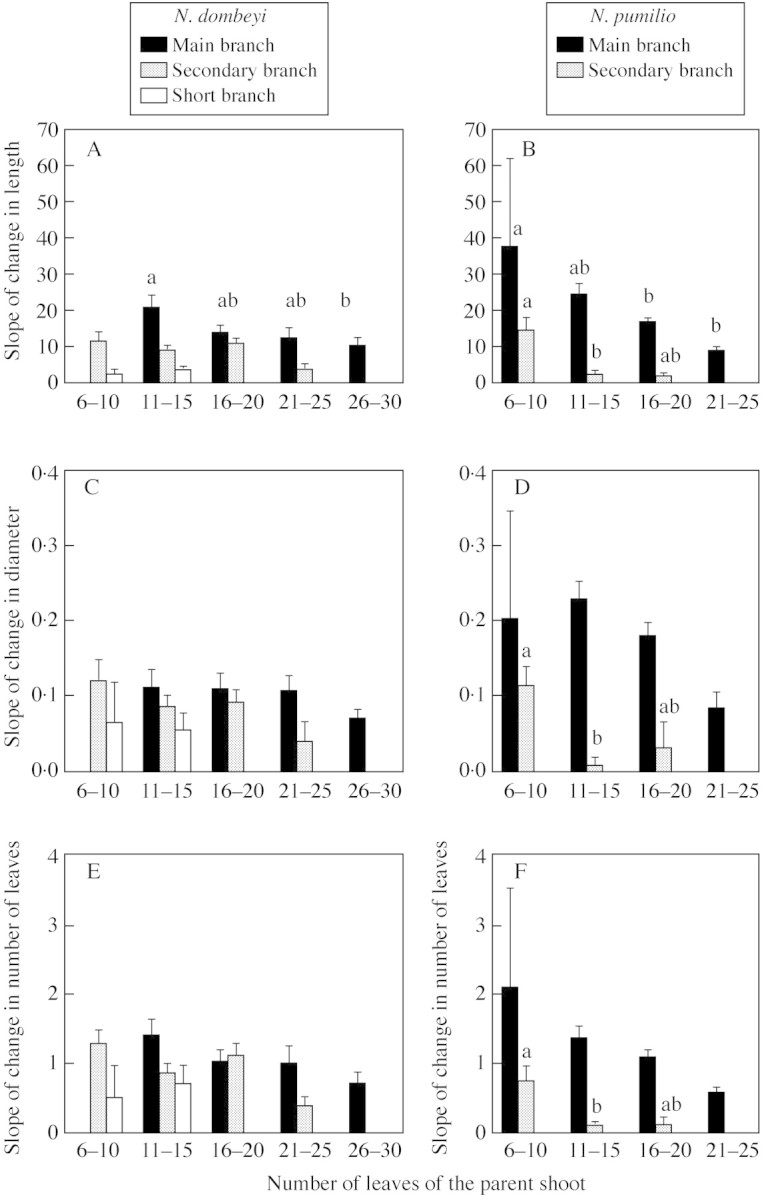
Fig. 4. Mean (+ 1 s.e.) slope of change in sibling‐growth unit length (A and B), diameter (C and D) and number of leaves (E and F) for sibling growth units developed from main‐branch (black bars), secondary‐branch (shaded bars) and short‐branch (white bars) parent growth units of N. dombeyi (A, C and E) and main‐branch (black bars) and secondary‐branch (shaded bars) parent growth units of N. pumilio (B, D and F). Results for parent growth units with different number of nodes (6–10 nodes, 11–15 nodes, 16–20 nodes, 21–25 nodes and 26–29 nodes) are shown separately. The means of bars of the same species and axis type with different letters on top differ significantly (P < 0·05) from each other (Tukey–Kramer tests; see Table 4 for ANOVA comparisons).
