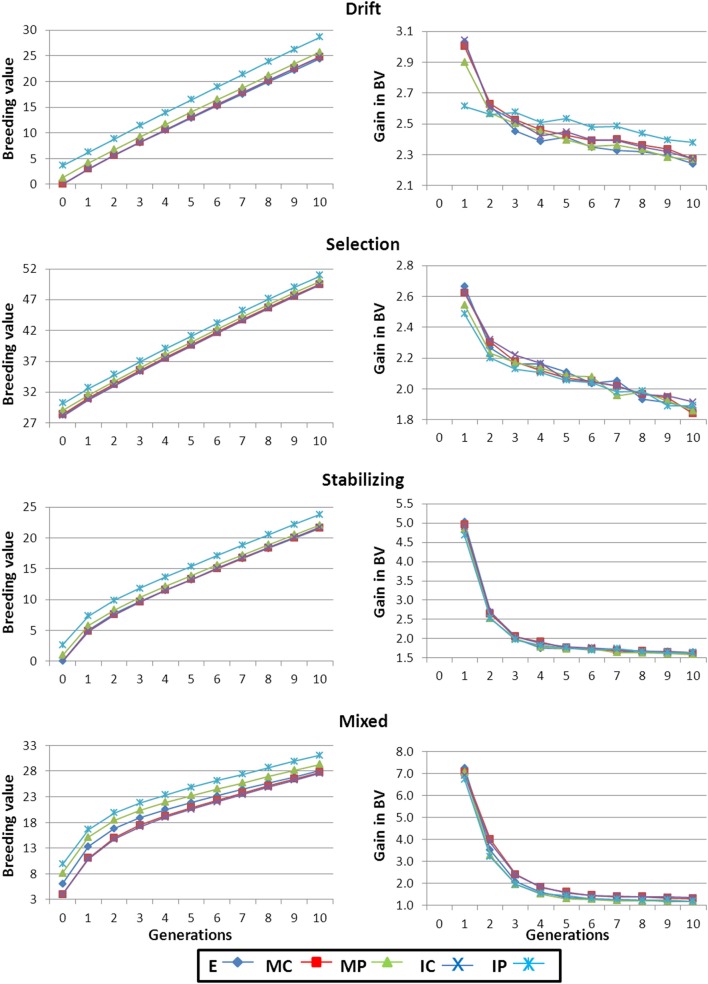
Figure 2.
Average breeding value and gain in breeding value along the generations of selection. Results shown correspond to base populations obtained using 100,000 markers. E, equal numbers from each strain; MC, minimize mean strain coancestry values; MP, maximize mean strain phenotypic value with a restriction on coancestry; IC, minimize individual coancestry; and IP, maximize individual phenotypic value with a restriction on coancestry.

