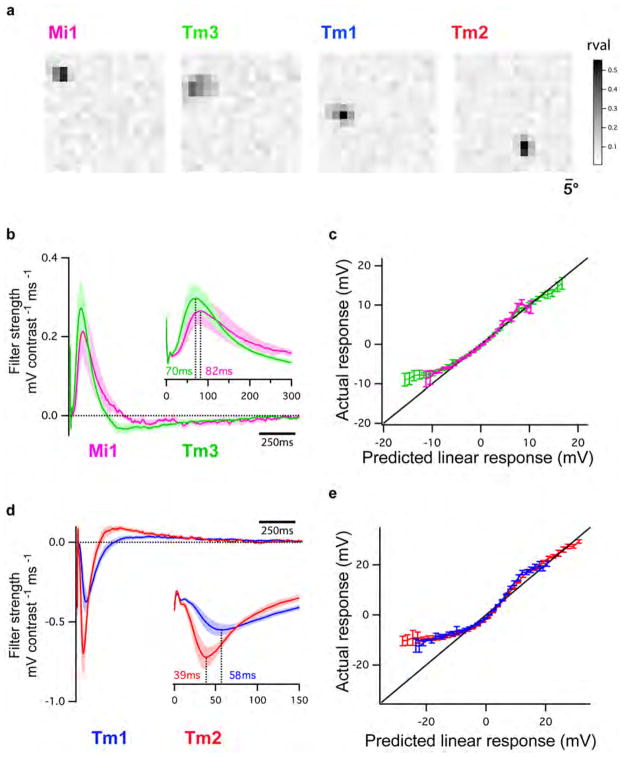
Extended Data Figure 6. Spatio-temporal analysis of Mi, Tm3, Tm1 and Tm2.
a, Representative receptive fields of Mi1, Tm3, Tm1 and Tm2 neurons shown as a heat map of 256 pixels using the r value of linear prediction for each pixel intensity. b, Average temporal filters (± s.e.m.) extracted from the highest responding pixels for each neuron for Mi1 (n =4) and Tm3 (n =8) (see Methods). The peaks of the filters, with the average timing, are enlarged in the inset. c, Average nonlinearities over several neurons for both Mi1 and Tm3. To obtain each neuron’s nonlinearity, the neuron’s measured response was plotted against the linear prediction from the relevant pixels. Error bars, s.e.m. A line of slope 1 is shown in black. d, e, Equivalent to b and c for Tm1 (n =8) and Tm2 (n =7).

