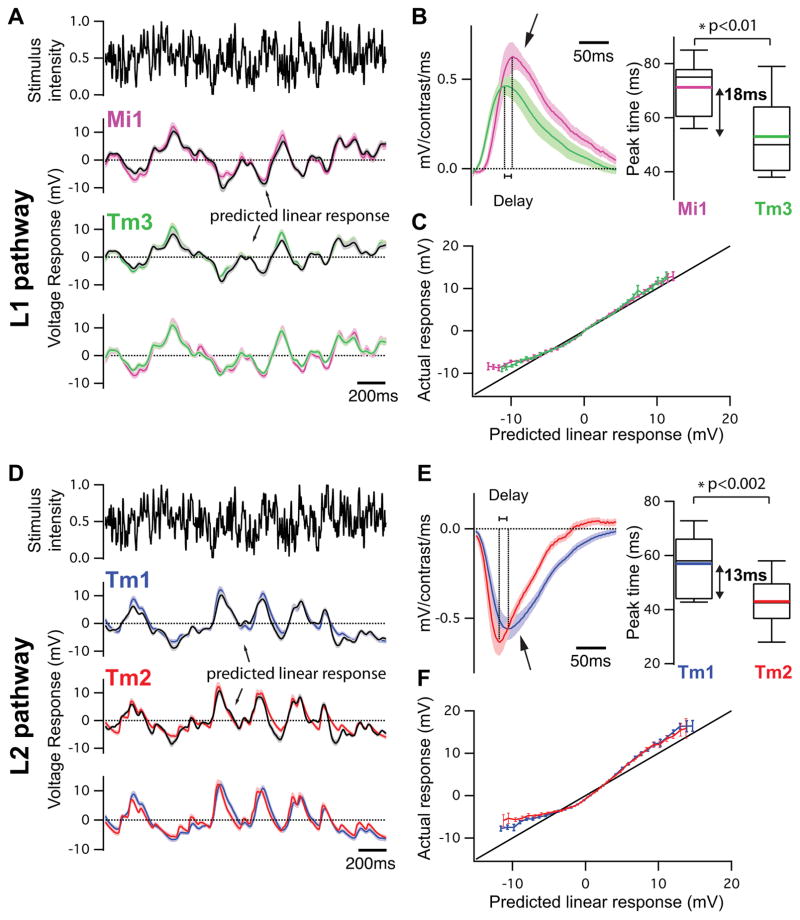
Figure 3. Mi1/Tm3 and Tm1/Tm2 respond with different delays and nonlinearities to a Gaussian noise stimulus.
A. Top: 2s excerpt of the intensity signal from a 10 s full-field Gaussian noise stimulus. Signal correlation time was 10 ms (see Methods). Middle: Average voltage response (+/− SEM) of Mi1 (N=7) and Tm3 (N=11) to the 2s noise stimulus on top. The black trace corresponds to the average predicted linear response (+/− SEM) obtained by convolving the stimulus with the filters in B. Bottom: Overlay of the Mi1 and Tm3 responses showing the high similarity in their response.
B. Left: Average linear filters extracted from the data in panel A that best predict the measured response of Mi1 and Tm3 as a function of preceding light intensity changes (+/− SEM). The filters are comprised of a large positive lobe (arrow) and shallow negative lobe (see Extended data Figure 5). Right: Box plots of the distribution of the timing of the peak responses of the Mi1 and Tm3 neurons. There is, on average, an 18ms delay between the peak of Mi1 filters and Tm3 filters. Black line is the median, colored line is the average.
C. Average actual responses of Mi1 and Tm3 plotted against their average linear predicted responses. Error bars represent +/− SEM. A line of slope 1 is shown in black.
D–F. Same as above for Tm1 (N=15) and Tm2 (N=14). The filters are comprised of a large negative lobe (arrow) and a shallow positive lobe (Extended data Figure 5). The average delay between the peak of Tm1 and Tm2 filters is 13ms.

