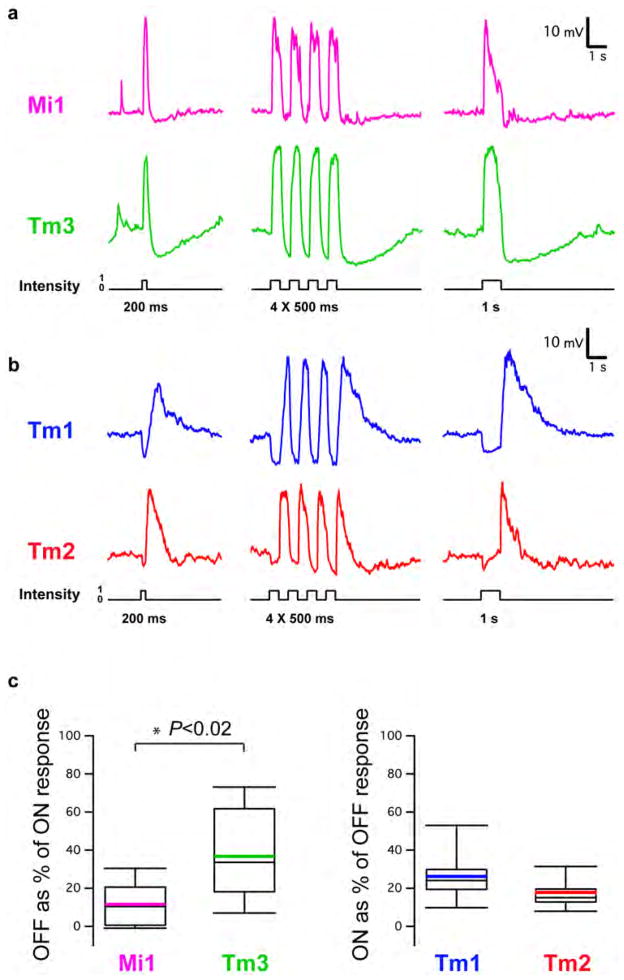
Extended Data Figure 1. Representative raw traces of responses to flashes of light of different duration from dark.
a, Top: response of an Mi1 neuron to 200 ms, four consecutive 250 ms and 1 s full-field flashes of light from dark. Bottom: same as top for a Tm3 neuron. b, Same as a for a Tm1 neuron and a Tm2 neuron. c, Box plots illustrating the distribution of the OFF response as a percentage of the ON response for Mi1 (n =7) and Tm3 (n =10) and the ON response as a percentage of the OFF response for Tm1 (n =10) and Tm2 (n =11) averaged in Fig. 1. Black line, median; coloured line, average.

