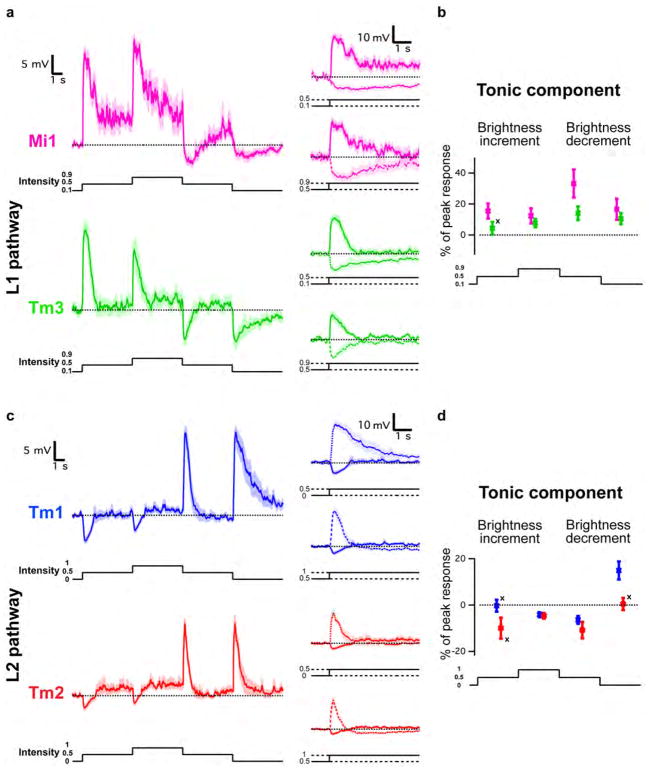
Extended Data Figure 2. Mi1, Tm3, Tm1 and Tm2 neurons encode stable information about luminance.
a, Top left: averaged evoked responses (± s.e.m.) of Mi1 (n =7) in response to 5 s steps of light from dark to grey (0.5 intensity) to light to grey to dark. Top right: excerpts from the left trace where the pre-contrast change voltages have been matched. Bottom left and right: same as above for Tm3 (n =10). b, Tonic component (average difference in membrane potential between post- and pre-contrast change between 4 and 5 s after contrast change) as a percentage of the maximum peak response for brightness increments of the corresponding contrast difference. Error bars, s.e.m. c, d, Same as a and b for Tm1 (n =9) and Tm2 (n =7). The tonic component was measured as a percentage of the peak response for brightness decrements of the corresponding contrast difference. In all cases, expect for those marked with a cross, the distributions are significantly different from zero (P <0.05).

