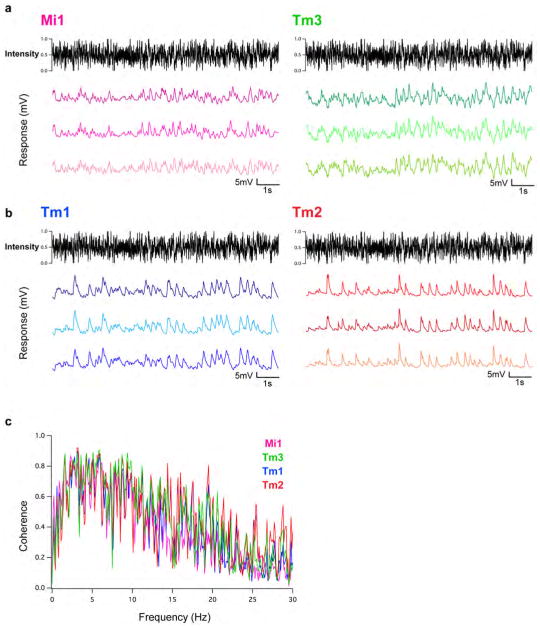
Extended Data Figure 4. The response of Mi1, Tm3, Tm1 and Tm2 to a Gaussian noise stimulus is very reliable.
a, Left: response of an Mi1 neuron to three consecutive 10 s presentations of an approximate Gaussian noise stimulus with 50% standard deviation and correlation time of 10 ms. Right: same as left for Tm3. b, Same as a for Tm1 (left) and Tm2 (right). c, Coherence of the measured responses in the four cell types. Deviations from 1 mean that variance in the output is not entirely accounted for by a linear transformation of the input. This can be caused by noise in the response unrelated to the input, or by the nonlinearities in the system response that we measured. The linear filter amplitude for each frequency is distinct from coherence, and those amplitudes as a function of frequency are plotted in Extended data Fig. 7a, b.

