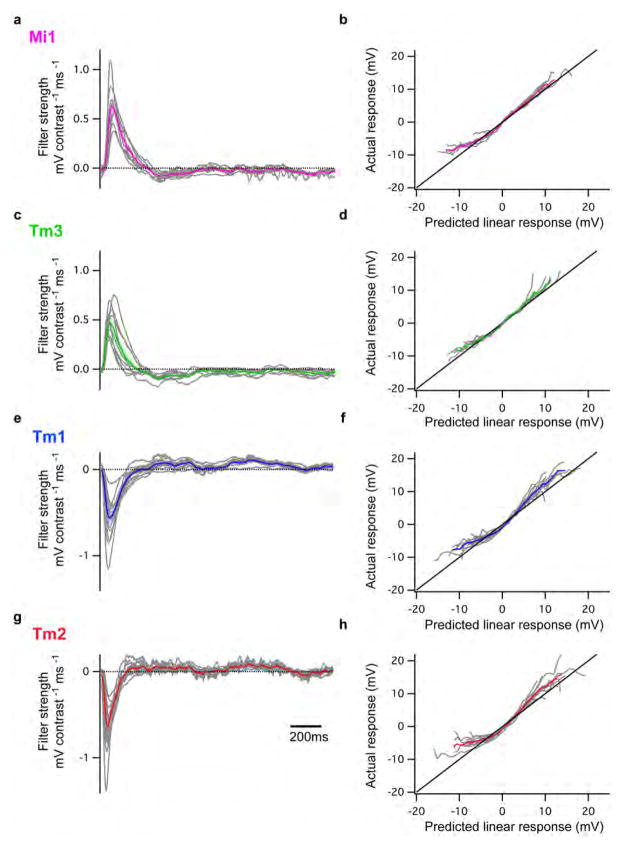
Extended Data Figure 5. Individual filters and nonlinearities from the Gaussian noise analysis of Mi1, Tm3, Tm1 and Tm2.
a, Individual filters (in grey) overlaid on the average filter (± s.e.m.) for Mi1 neurons. b, Individual nonlinearities (in grey) overlaid on the averaged nonlinearity (±s.e.m.) for Mi1 neurons. c, d, Same as a and b for Tm3. e, f, Same as a and b for Tm1. g, h, Same as a and b for Tm2.

