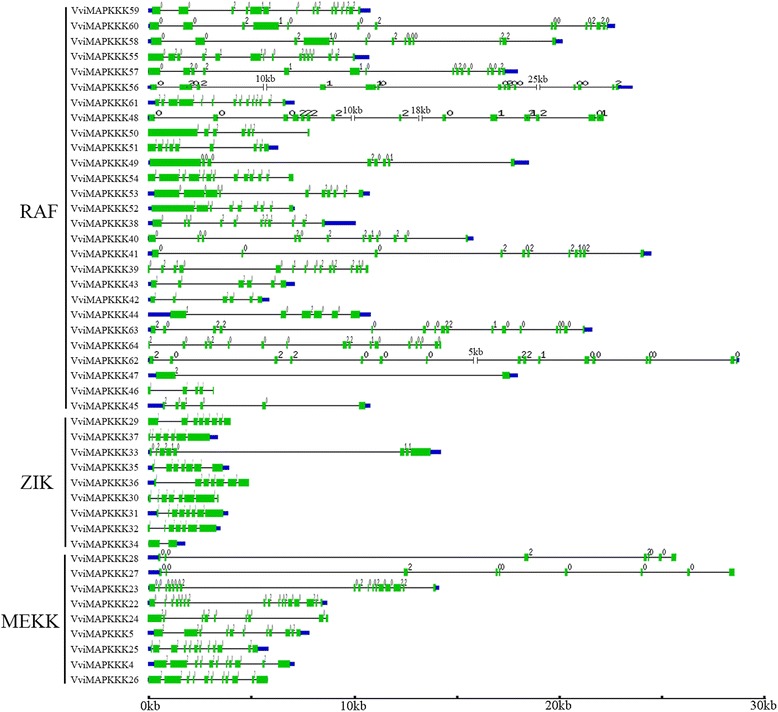
Figure 3.

Schematic diagrams for intron/exon structures of MAPKKK genes in grapevine. The green boxes indicate the exons while the single lines indicate introns. UTRs are displayed by thick blue lines at both ends. 0, 1 and 2 represent different intron phases. Gene models were drawn to scale as indicated at the bottom.
