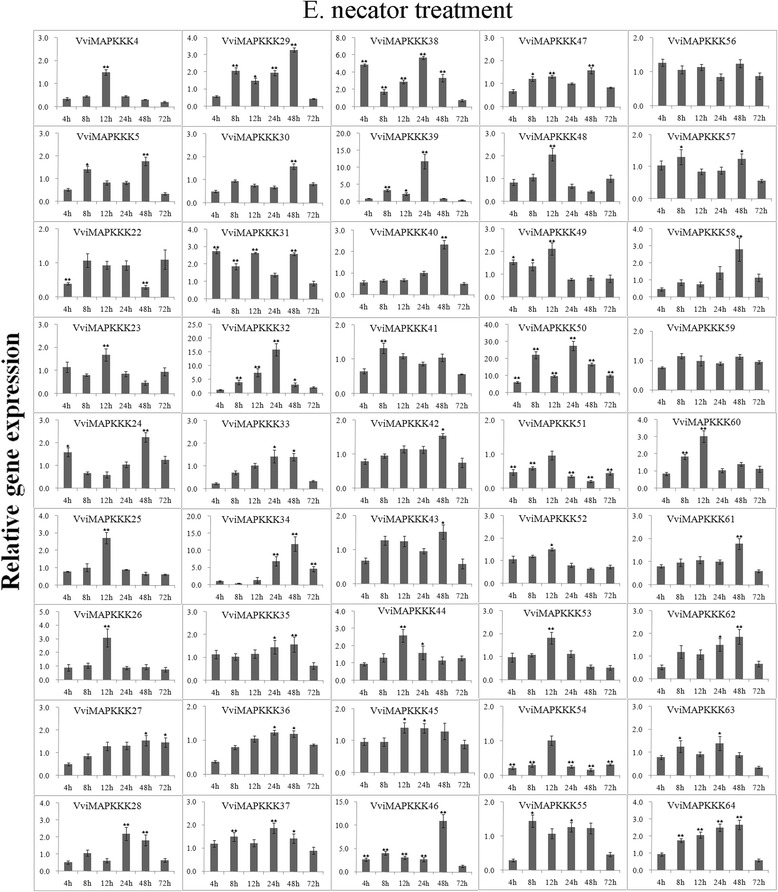
Figure 5.

Expression profiles of VviMAPKKK genes in grapevine leaves in response to powdery mildew infection. Detached leaves were heavily inoculated with E. necator and sampled after 4, 8, 12, 24, 48 and 72 h. To visualize the relative expression levels data are presented as the mean fold changes between treated and control samples at each time point ± standard deviations (SDs). ** and * indicate significant differences in comparison with the control at P < 0.01 and P < 0.05, respectively.
