
Figure 9.
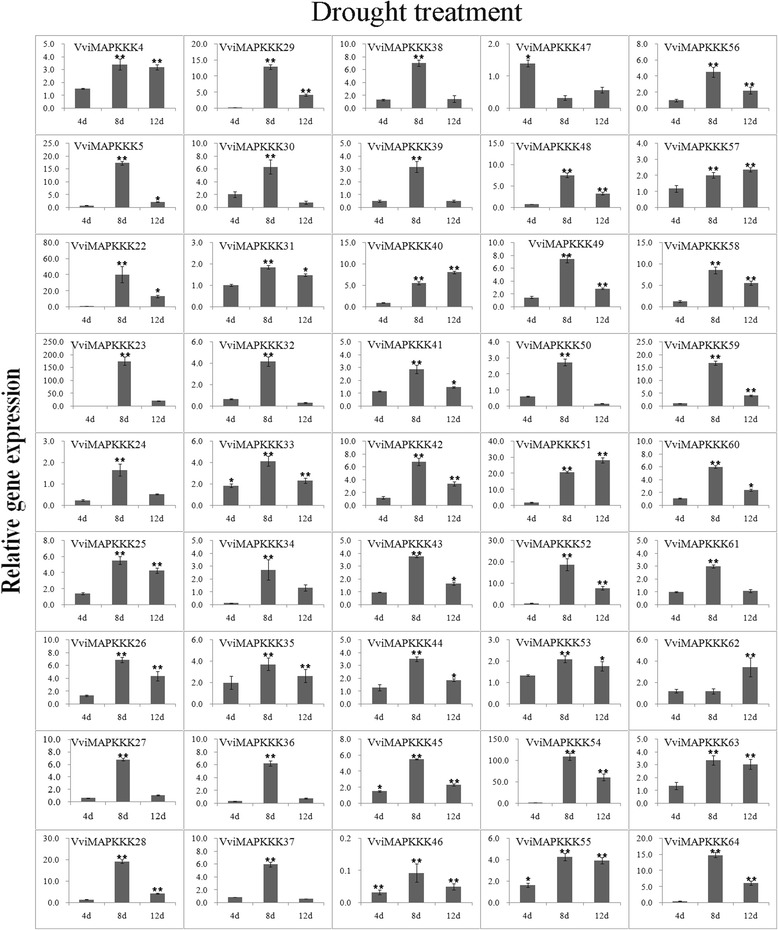
Expression profiles of VviMAPKKK genes in grapevine leaves in response to drought stress. Leaves were collected at 4, 8 and 12 d post-drought. To visualize the relative expression levels data are presented as the mean fold changes between treated and control samples at each time point ± standard deviations (SDs). ** and * indicate significant differences in comparison with the control at P < 0.01 and P < 0.05, respectively.