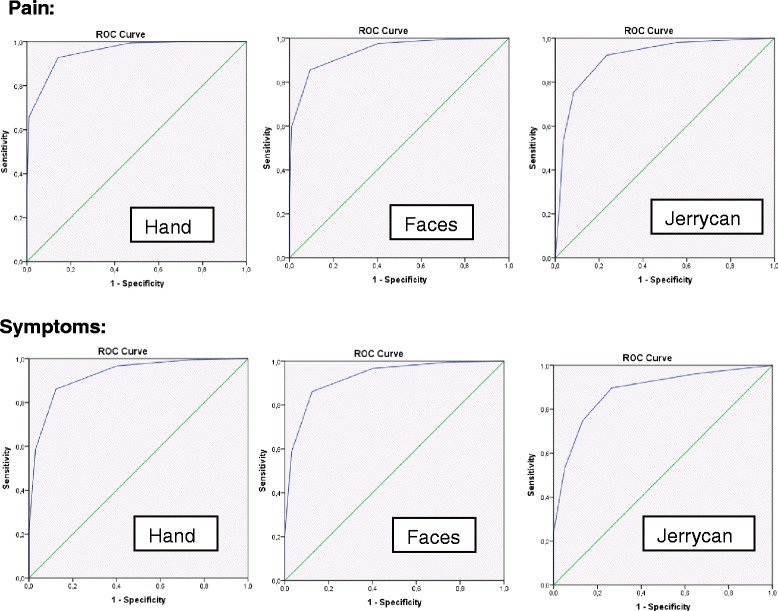
Figure 3.

ROC Curves for pain and symptoms.
ROC Curves for pain and symptoms. Specific coordinates: (Sensitivity/1-Specifity). Pain: Hand: (0,93/0,14) Face: (0,98/0,41); (0,86/0,09) Jerrycan: (0,92/0,24); (0,75/0,09). Symptoms: Hand: (0,97/0,45) Faces: (0,97/0,40); (0,86/0,12) Jerrycan: (0,90/0,27); (0,79/0,1).
