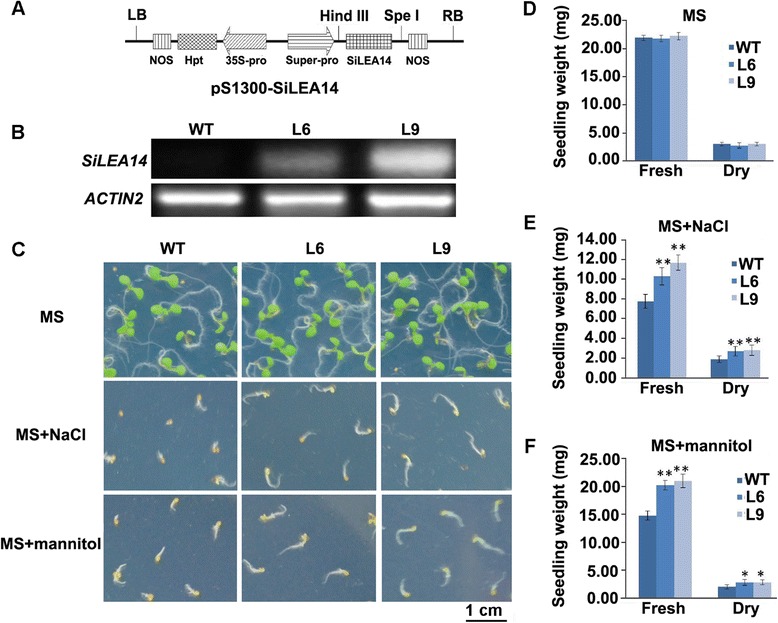
Figure 5.

Assay for salinity and mannitol stress tolerance of SiLEA14 overexpression Arabidopsis. (A) Diagram of the T-DNA region of the binary vector pS1300-SiLEA14. LB, left border; RB, right border; 35S-Pro, cauliflower mosaic virus 35S promoter; Hpt, hygromycin B phosphotransferase gene; Super-pro, Super promoter; SiLEA14, SiLEA14 gene; NOS, nopaline synthase terminator. (B) RT-PCR analysis of SiLEA14 in transgenic Arabidopsis lines (L6 and L9). WT was used as a control. Actin2 was a loading control. (C) The phenotype of transgenic and WT Arabidopsis germinated on MS, MS + 125 mM NaCl and MS + 250 mM mannitol, respectively, for 7 days. This experiment had three replicates, and each experiment comprised 30–40 plants. Bar = 1 cm. (D-F) Fresh/dry weights of seedlings germinated on MS, MS + 125 mM NaCl and MS + 250 mM mannitol, respectively. Data represent means and standard errors for three biological replications. Statistical significance was determined by Student’s t-test. *P < 0.05; **P < 0.01.
