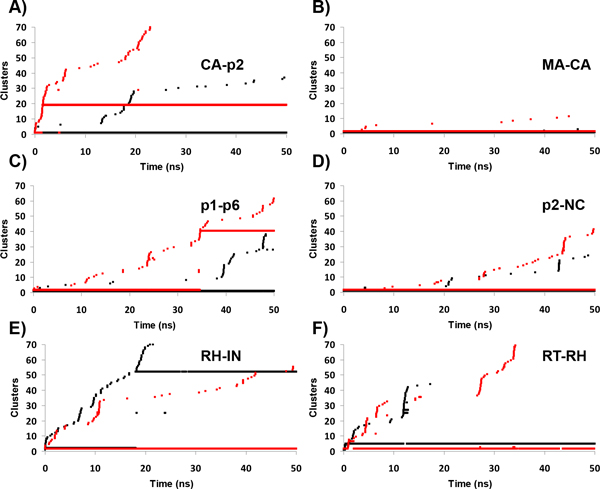
Figure 5.

Cluster analysis for the substrates. From A to F the time-evolution of each cluster ID for the substrate backbone conformation along the simulations. Clustering was performed using a cut-off of 0.07 nm, with the same method as in Fig.3 (Colored as in Fig.2).
