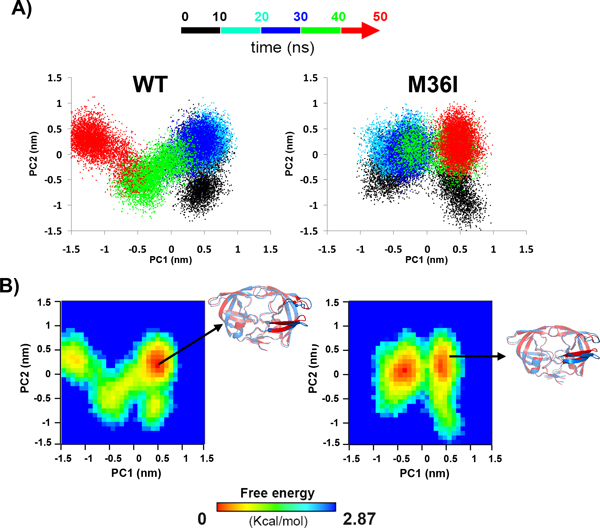
Figure 6.

Principal component analysis of RH-IN PR complexes. A: The conformational sampling of WT (left) and M36I (right) PR in complex with RH-IN substrate was projected along the first two principal components fore each transient conformer. The color code represents the temporal sequence of frames (0-10 ns: black, 10-20 ns: cyan, 20-30 ns: blue, 30-40 ns: green and 40-50 ns: red). B: the free energy landscape (FEL) analysis and representative structures from the WT (left) and M36I (right) MD trajectories. The FELs were obtained using the projections of PR C-alpha atoms position vectors onto the first two principal components as reaction coordinates. Free energy values calculated from the density of distribution are given in kcal/mol as indicated by the color bar.
