Figure 2.

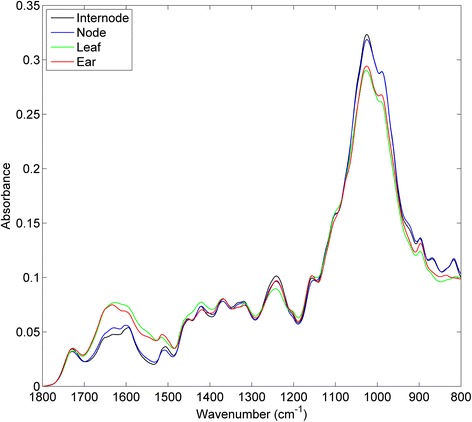
FTIR-ATR spectra of the four different tissues of wheat straw (cv Avalon) (Averaged spectra from four plants, with five area-normalized replicate spectra each).

FTIR-ATR spectra of the four different tissues of wheat straw (cv Avalon) (Averaged spectra from four plants, with five area-normalized replicate spectra each).