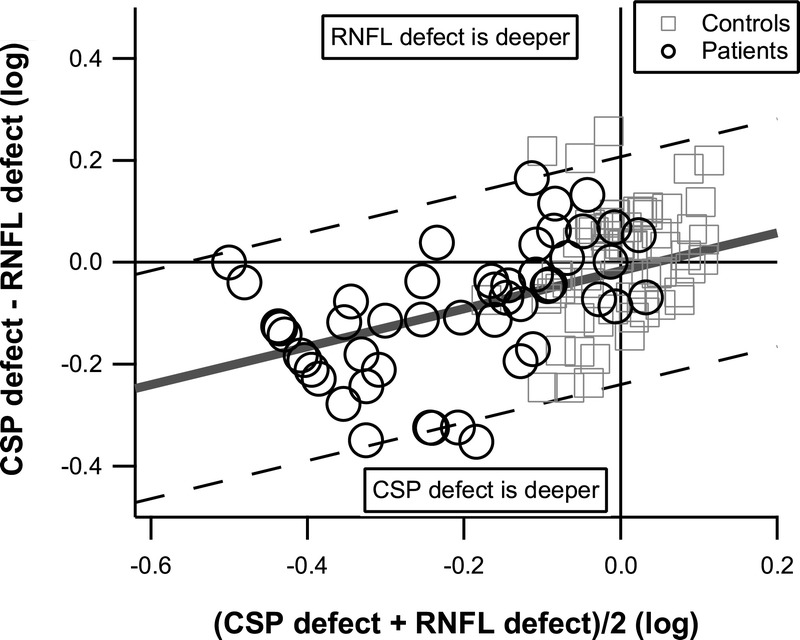
FIGURE 3.

Bland-Altman graph of CSP-2 versus RNFL defects for the ST sector, for patient data, with a floor of −0.5 log units. Control data are shown for reference and were not used in the Bland-Altman analysis, which yielded mean (solid gray line) and limits of agreement (dashed diagonal lines). The mean difference reached the strict criterion, signifying that on average CSP-2 defects were deeper than RNFL defects The slope reached the strict criterion, whereas the intercept was near zero, signifying that the two tests were on average in agreement when the sector was not damaged, and CSP-2 defects were deeper than RNFL defects in damaged sectors.
