
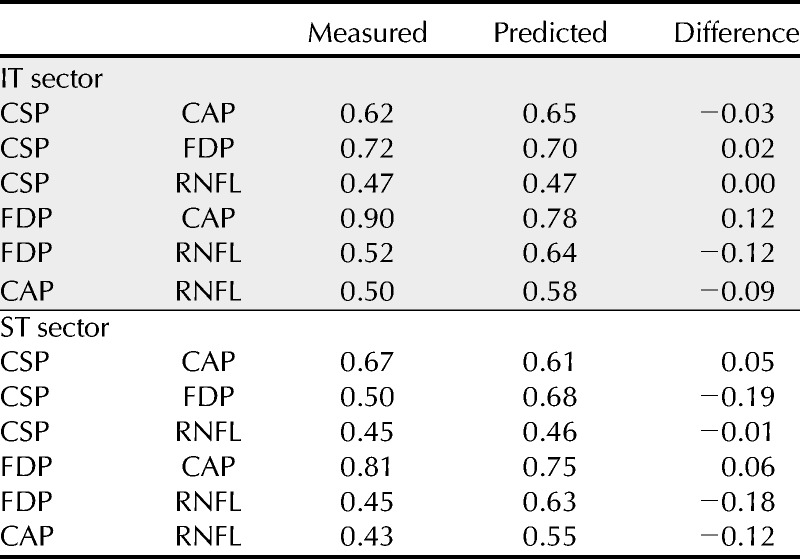
TABLE 3.
Range, in log units, of the 95% limits of agreement derived from patient data and predicted from control data, and the difference (measured minus predicted)
Official websites use .gov
A
.gov website belongs to an official
government organization in the United States.
Secure .gov websites use HTTPS
A lock (
) or https:// means you've safely
connected to the .gov website. Share sensitive
information only on official, secure websites.
Range, in log units, of the 95% limits of agreement derived from patient data and predicted from control data, and the difference (measured minus predicted)