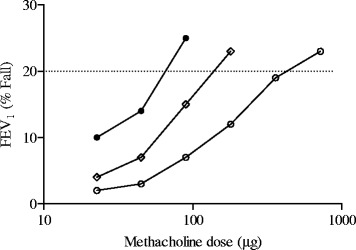
Figure 1.

Representative dose–response curves of three asthmatic patients to inhaled methacholine with different slope (%/μg) and PD 20 (μg) values. Patient A (closed circles) 0.248%/μg and 72 μg; patient B (open diamond) 0.112%/μg and 184 μg, patient C (open circles) 0.037%/μg and 625 μg.
