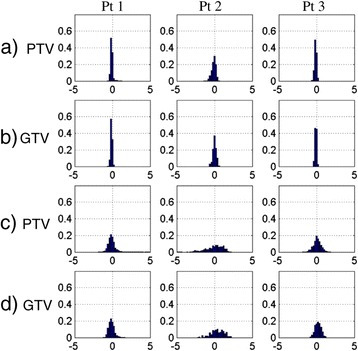
Figure 4.

Histogram representations of the motion effect. a) and b) Inter-fraction interplay effect: the voxel histogram of the largest dose differences in PTV volume and GTV volume among all four fractions for three patients; c) and d) difference in cumulative 4D dose with and without motion: histogram of dose differences in the PTV and GTV due to motion. The bars represent the percentage of the voxels in the PTV or GTV with dose differences in 0.2 Gy bins.
