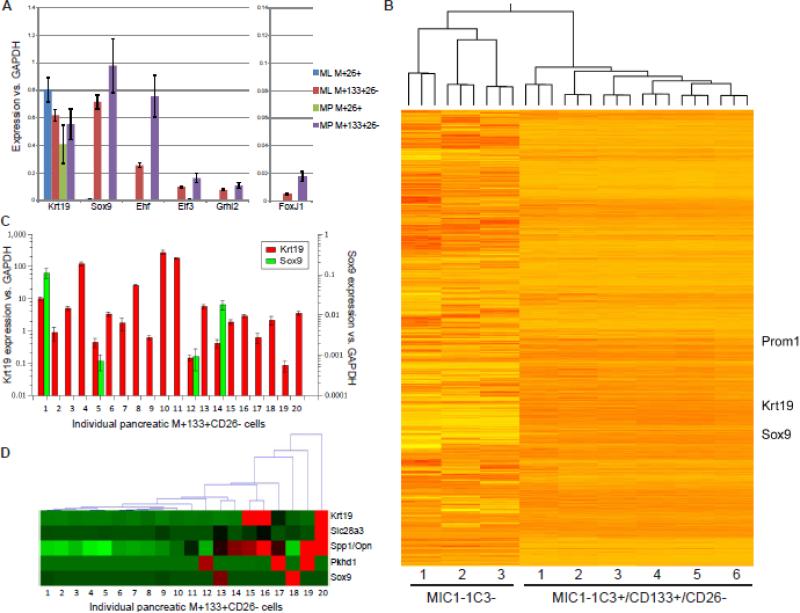
Figure 2.
Expression analysis of progenitor-enriched cell populations. (A) qRT-PCR was used to compare the expression of several genes in MIC1-1C3+ subpopulations of mouse liver and pancreas. Values shown are the averages of values from three pancreatic and two liver samples, each analyzed three times by qRT-PCR. (B) Hierarchical clustering of RNA-seq derived expression values from progenitor-enriched and depleted mouse pancreatic populations. (C) qRT-PCR analyses of twenty individual pancreatic M+133+26− cells captured and processed using the Fluidigm C1 Single-Cell Auto Prep IFC. The levels of Sox9, Krt19 and Actb for each cell were determined in three replicates, and amplified products were validated by electrophoresis. Sox9 and Krt19 expression levels are as delta-Ct relative to Actb. (D) Hierarchical clustering of these same twenty cells on the basis of qRT-PCR-determined expression of duct and associated genes. Expression is normalized per-gene, with red indicating the highest level(s).

