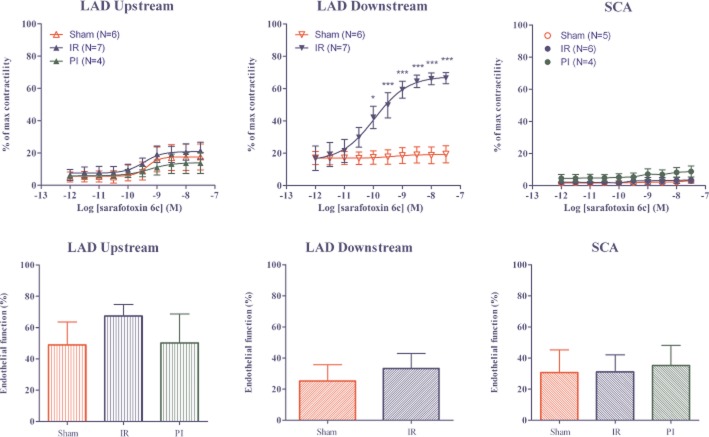
Figure 2.
Upper panel: Concentration–response curves of increasing concentrations of S6c in LAD upstream to occlusion, LAD downstream to occlusion, and SCA after IR, sham or PI procedures. The results are shown as mean values ± SEM (n = 4–7). ***P < 0.001 and *P < 0.05; two-way anova with repeated measurements and Bonferroni multiple comparison test. Characteristics of the arteries used are shown in Table 1. Lower panel: Percentage of endothelium-mediated relaxation induced by carbachol (10 μM) after precontraction with PGF2α (0.3 μM) in LAD upstream to occlusion, LAD downstream to occlusion, and SCA after sham operation, IR or PI. NS = P > 0.05; one-way anova with Newman–Keuls multiple comparison test or Student's t-test.

