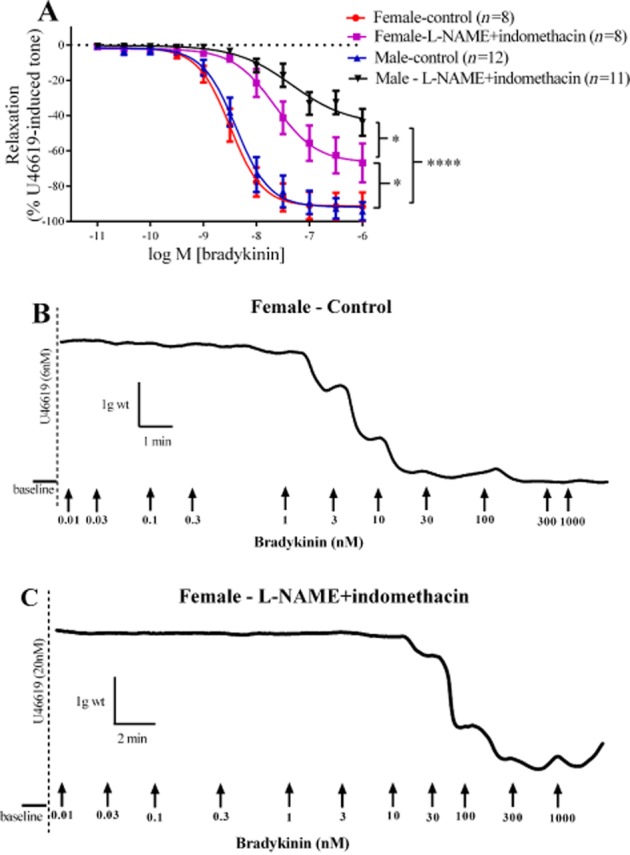
Figure 1.

Log concentration-response curves for the vasorelaxant effects of bradykinin in the absence or presence of 300 µM L-NAME and 10 µM indomethacin in male and female PCAs (A). Data are expressed as a percentage change from U46619-induced tone and are mean ± SEM of 8–12 experiments. Original traces of recording showing the responses to increasing concentration of bradykinin (B,C). *P < 0.05, ****P < 0.0001; significantly different as indicated; one-way anova followed by Bonferroni's post hoc test.
