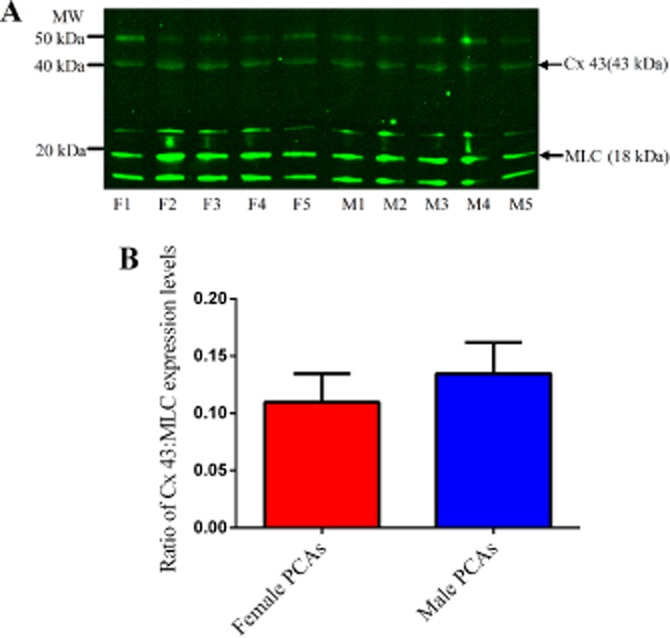
Figure 7.

Connexin 43 (43 kDa) and MLC (18 kDa) expression levels in 5 µg of female (F1–F5) and male PCAs (M1–M5) (A). Ratio of the expression levels of connexin 43 to MLC in male and female PCAs based on the intensities of their bands (B). Data are expressed in the ratio of Cx43 to MLC intensities bands and are mean ± SEM of five experiments.
