
Figure 1.
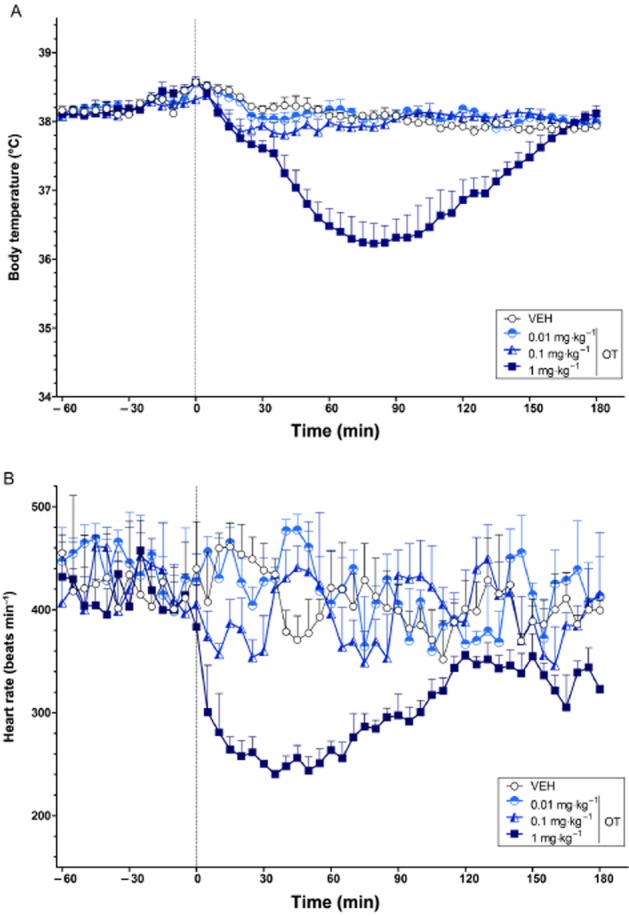
The dose-dependent effects of OT on body temperature (°C) (A) and heart rate (beats min−1) (B) over time (min). The vertical grey hashed line on the X-axis at 0 indicates the time of vehicle or OT administration. Data are the means + SEM. VEH, vehicle.