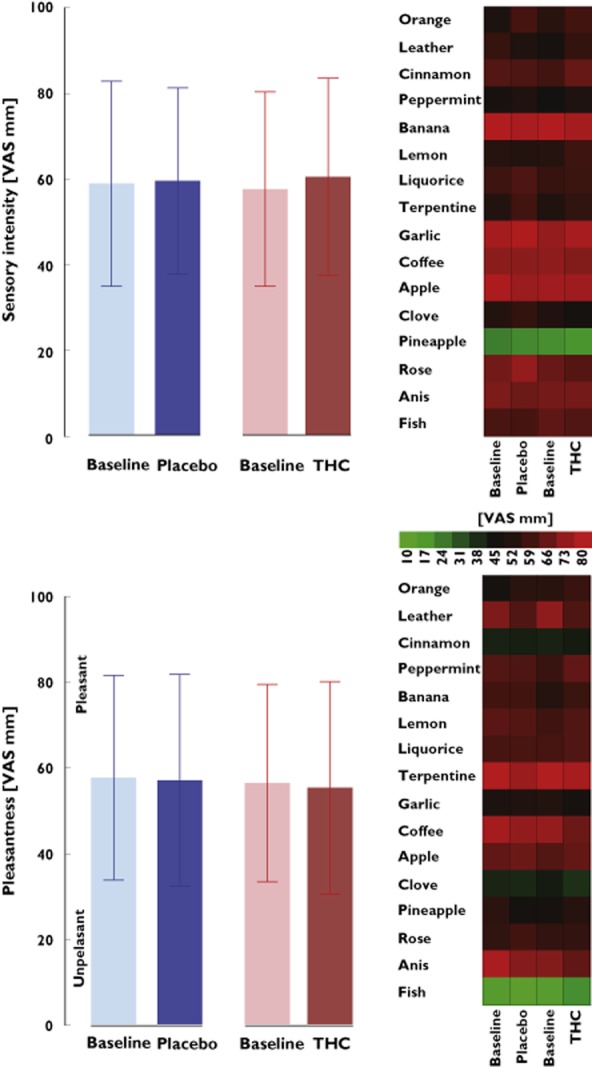
Figure 2.

Ratings of the sensory intensity (top) and the pleasantness (bottom) of the 16 odours belonging to the identification subtest of the ‘Sniffin'Stick' test (listed at the left side of the heat plot). Left panels show means and 95% confidence intervals of the ratings obtained at baseline and at 2 h following administration of the medication (THC or placebo), averaged across all 16 odorants and 15 subjects. Right panels are heat plots of the ratings of single odorants of the identification subtest. The colour coding from green, unpleasant or low intensity, via black, middle intensity of hedonically inert, to red, pleasant or high intensity, indicates the visual analog scale (VAS) ratings. None of the intensity ratings were changed by THC, and no pattern shift was observed in this cohort.  , placebo;
  , THC
, THC
