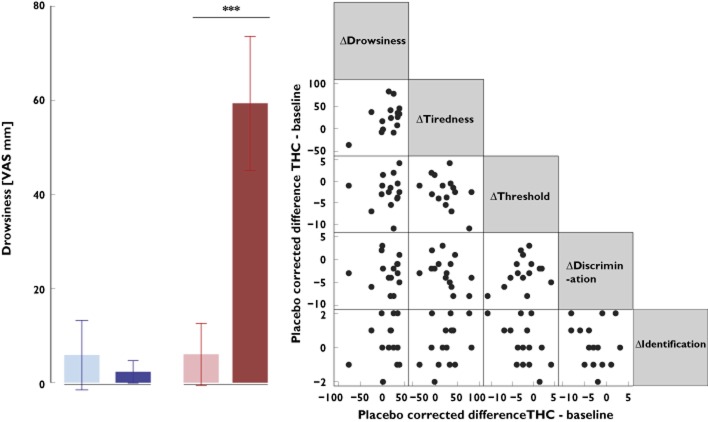
Figure 3.
Ratings of the drowsiness and association of THC-induced changes in drowsiness and tiredness with THC-induced changes in olfactory test parameters. Left panel shows means and 95% confidence intervals of the ratings of drowsiness, obtained at baseline and at 2 h following administration of the medication (THC or placebo), averaged across the 15 subjects. Right panel is a scatterplot matrix of the THC-induced changes in selected parameters and olfactory test outcomes, calculated as differences of the ratings in the presence of THC from the baseline ratings, corrected for the respective changes in the presence of placebo. The asterisks indicate significances (P = < 0.001) according to post hoc paired t-test following significant ANOVA effects. , placebo;
  , THC; *** P = < 0.001

