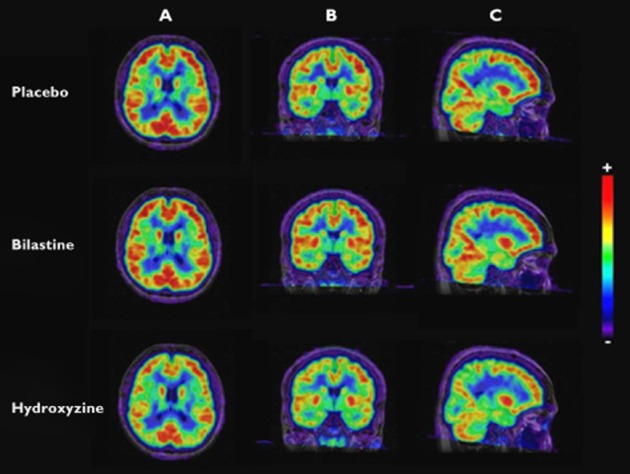
Figure 3.

Co-registered magnetic resonance image and [11C]-doxepin positron emission tomography images after administration of placebo, bilastine (20 mg) and hydroxyzine (25 mg). A: horizontal plane. B: coronal plane. C: sagittal plane. Scale + to −: from maximum to minimum binding potential values
