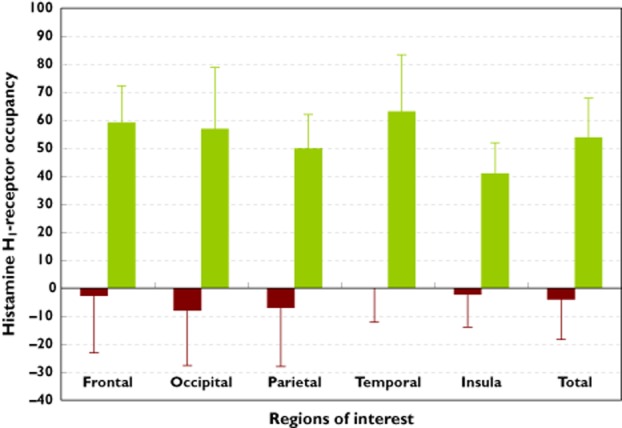
Figure 4.

Mean (± SD) brain histamine H1-receptor occupancy (H1RO) after single dose antihistamine administration. Data shown are for five individual regions of interest (ROIs), and mean total H1RO for the ROIs combined. P < 0.01 for all bilastine–hydroxyzine differences.  , bilastine 20 mg;
  , hydroxyzine 25 mg
