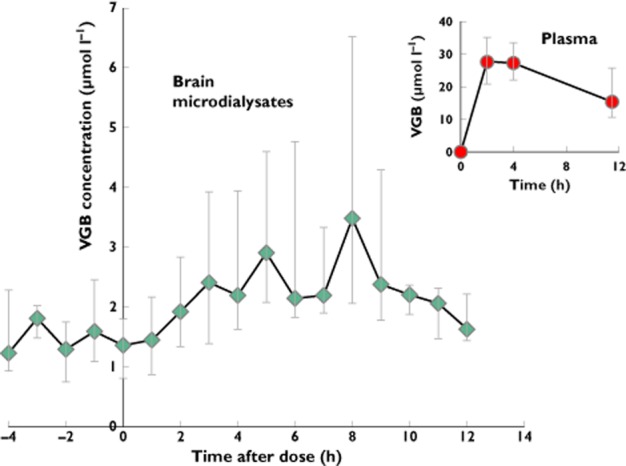
Figure 1.

Median [and interquartile range (IQR)] vigabatrin (VGB) concentrations (μmol l−1) plotted vs. time (in hours) in brain microdialysates (main graph) and plasma (inset) in relation to the first dose. Microdialysate VGB concentration data for nine VGB patients were pooled into hourly periods. Plasma VGB concentrations were for eight patients at 2, 4 and 11.5 h after the first dose. The number of microdialysate samples (n) for each hourly time point is as follows: −4 h (5); −3 h (4); −2 h (5); −1 h (9); 0 h (8); 1 h (9); 2 h (8); 3 h (10); 4 h (9); 5 h (8); 6 h (8); 7 h (8); 8 h (8); 9 h (7); 10 h (6); 11 h (6); 12 h (5)
