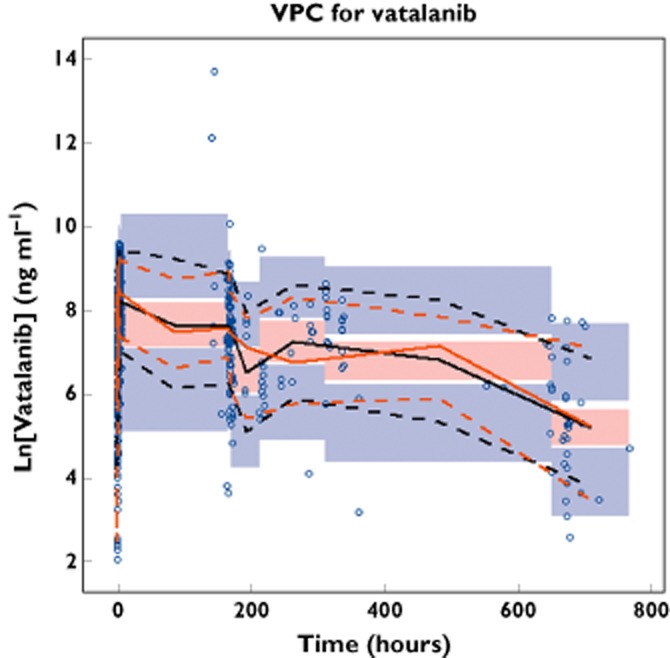
Figure 2.

Visual predictive check (VPC) plot for the final model. Open circles represent observed vatalanib concentrations on day 1 and later. The black continuous line represents the median of the simulated concentrations. The black dashed lines represent the 5th and 95th percentiles of the simulated concentrations. The red continuous line represents the median of the observed concentrations. The red dashed lines represent the 5th and 95th percentiles of the observed concentrations. The shaded areas represent the 90% confidence intervals for the prediction percentiles
