
Figure 2.
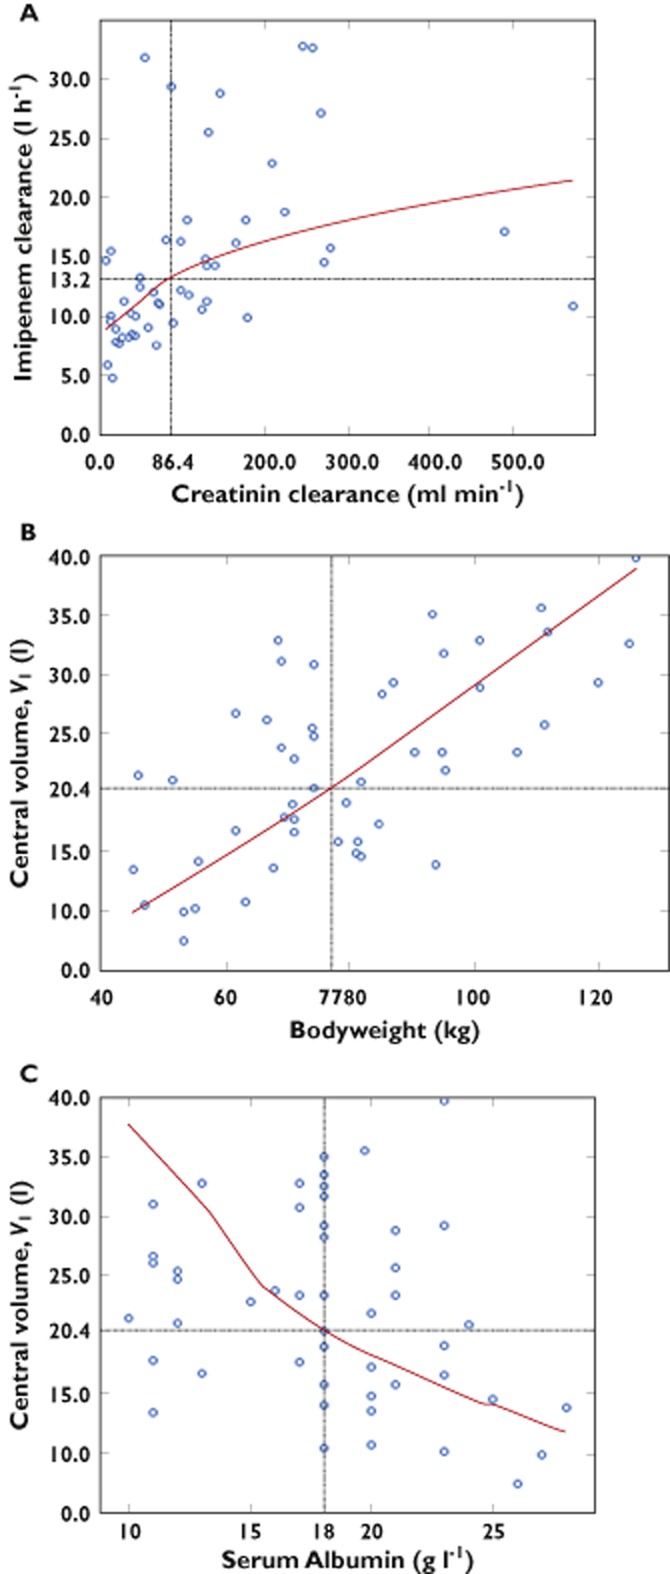
Relationship between estimated individual pharmacokinetic parameters and covariates. (A) Clearance vs. 4 h creatinine clearance. (B) Central volume vs. total bodyweight. (C) Central volume vs. serum albumin. In each panel, model predictions are displayed as the red curve