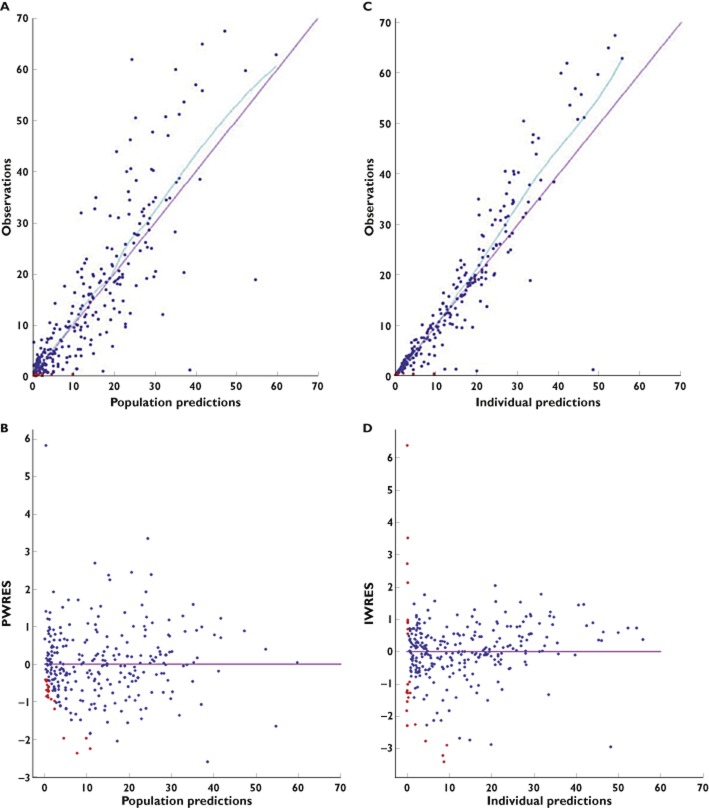
Figure 3.
Goodness-of-fit plots for the final model with covariates: observations (A) and population weighted residuals (PWRES; B) vs. population predicted values; and observations (C) and individual weighted residuals (IWRES; D) vs. individual predicted values. Observations are plotted as blue circles and BQL data as red circles. Locally weighted scatterplot smoothed curves are plotted as blue curves

