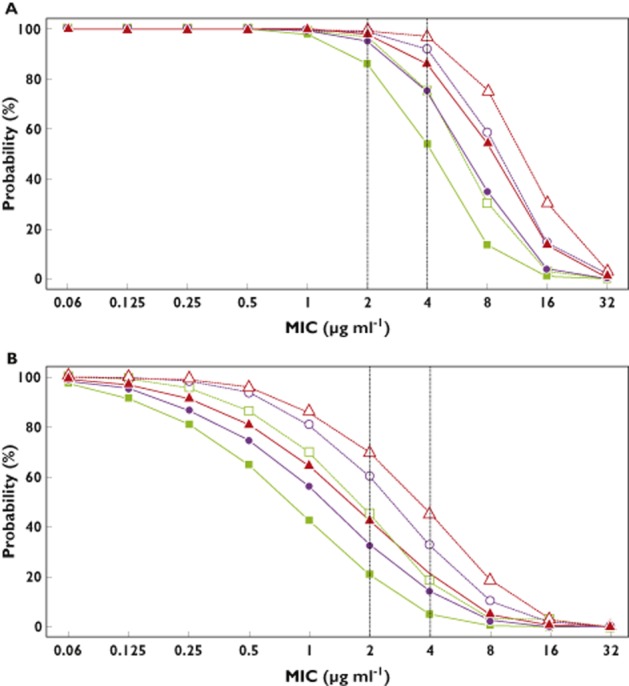
Figure 5.

Simulated probabilities of pharmacodynamic target attainment vs. minimal inhibitory concentration (MIC) for various imipenem current dosage regimens at steady state: 40% fractional time (fT) > MIC (A) and 100% fT > MIC (B). Vertical dotted lines are displayed for MIC = 2 μg ml−1 and MIC = 4 μg ml−1, which are the thresholds currently observed for Gram-negative bacteria in the intensive care unit.  , 500 mg every 8 h (q8h);
  , 500 mg every 6 h (q6h);
  , 750 mg q8h;
  , 750 mg q6h;
  , 1000 mg q8h;
  , 1000 mg q6h
