
Figure 1.
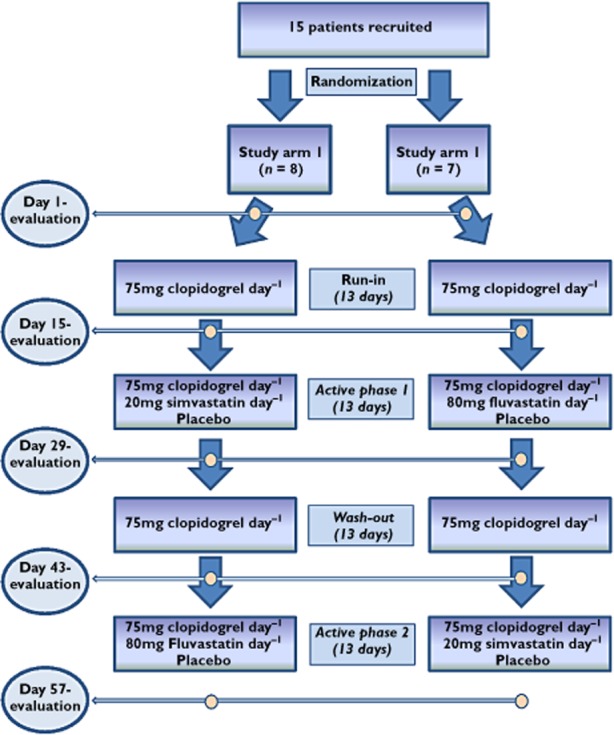
The flow chart illustrates each phase of this randomized, double-blind, double-dummy, two period crossover-study. The yellow circles indicate the time points of evaluation
Official websites use .gov
A
.gov website belongs to an official
government organization in the United States.
Secure .gov websites use HTTPS
A lock (
) or https:// means you've safely
connected to the .gov website. Share sensitive
information only on official, secure websites.
The flow chart illustrates each phase of this randomized, double-blind, double-dummy, two period crossover-study. The yellow circles indicate the time points of evaluation