
Figure 1.
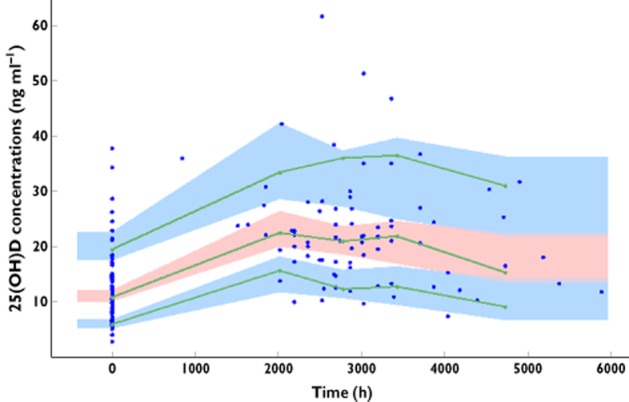
Prediction corrected visual predictive check for 25(OH)D concentrations vs. time. The lines show the 10th, 50th and 90th percentile of observed data. The areas represent the 90% confidence interval around the simulated percentiles
Official websites use .gov
A
.gov website belongs to an official
government organization in the United States.
Secure .gov websites use HTTPS
A lock (
) or https:// means you've safely
connected to the .gov website. Share sensitive
information only on official, secure websites.
Prediction corrected visual predictive check for 25(OH)D concentrations vs. time. The lines show the 10th, 50th and 90th percentile of observed data. The areas represent the 90% confidence interval around the simulated percentiles