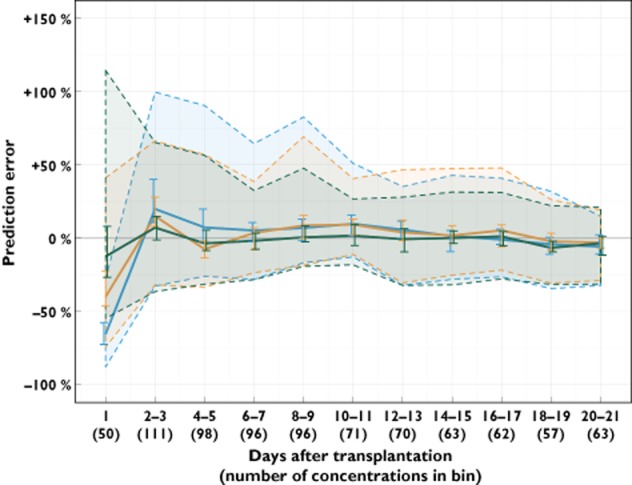
Figure 3.

Prediction error of the tacrolimus concentrations in the external evaluation dataset over time after transplantation, using the empirical Brisbane and Oslo models and the combined theory-based model. Time in days after transplantation are binned: The first bin reflects day 1 after transplantation, while the subsequent ten bins are generated from day 2–3, 4–5 and so on until day 20–21. The median prediction error in each bin (solid lines) is shown with 95% confidence interval (vertical lines). The shaded areas represent the interval covering 90% of the individual prediction errors in each bin (5th to 95th percentiles). ( ) Brisbane model, (
 ) Oslo model, (
 ) theory-based model
