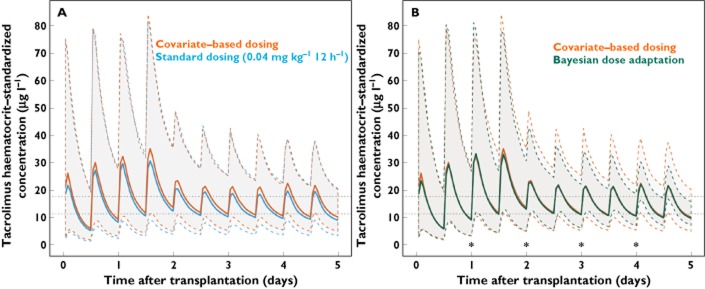
Figure 4.

(A) Concentration–time profiles in 1000 simulated individuals using covariate-based dosing (red) and the current standard initial dose regimen in Oslo (0.04 mg kg−1 twice daily, blue). (B) Concentration–time profiles in 1000 simulated individuals using covariate-based dosing (red) and covariate-based dosing with Bayesian dose adaptation (green). All concentrations are standardized to a haematocrit of 45%, and the simulation includes higher bioavailability on the day of transplantation (day 0) and the day after transplantation (day 1). Thick lines median predicted concentration; dashed, coloured lines 5th to 95th percentiles of the predicted concentrations; dotted, horizontal lines suggested acceptable range for average steady-state concentration values, standardized to a haematocrit of 45% (11.4 to 17.8 μg l−1); stars times of concentration measurement, Bayesian feedback and reduction in between subject variability
