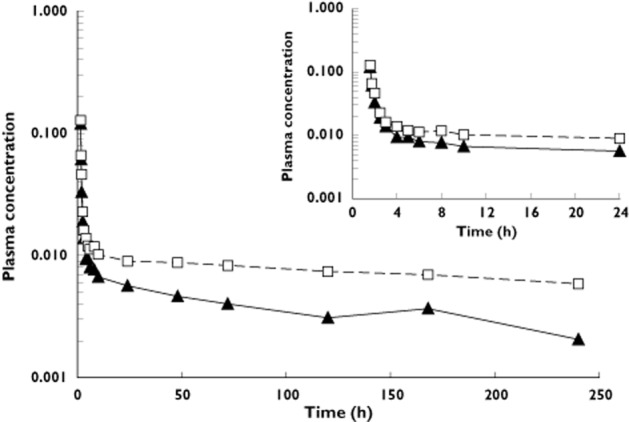
Figure 2.

Mean plasma [14C]-trametinib (solid line, ng ml−1) and total radioactivity (dashed line, ng equivalents of trametinib ml−1) concentration vs. time profile after i.v.; 5 μg administration (n = 4). Inset shows detail from 0 to 24 h post-dose.  , [14C]-trametinib;
  , total radioactivity
