
Figure 4.
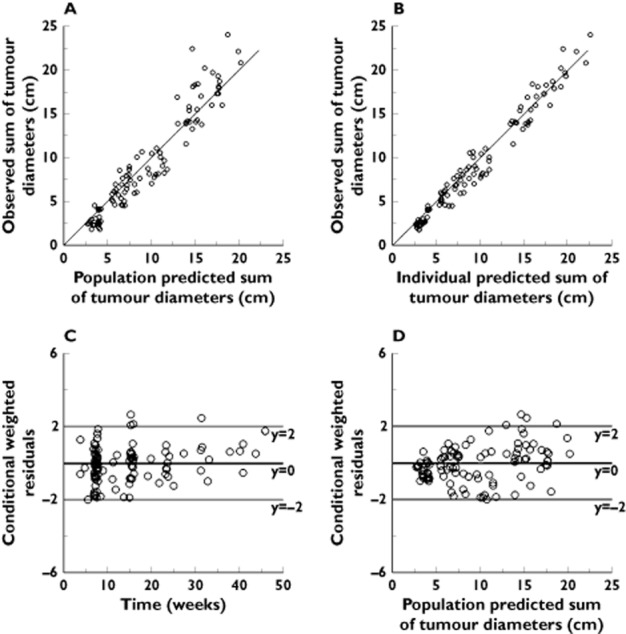
Goodness of fit plots for the PK–PD model describing the longitudinal data of change in sum of tumour diameter. (A) Plot of the population-predicted vs. observed sum of tumour diameters. (B) Plot of individual-predicted vs. observed sum of tumour diameters. (C) Plot of the conditional weighted residual error (CWRES) vs. time. (D) Plot of the conditional weighted residual error (CWRES) vs. population predicted sum of tumour diameters. The solid line in panel A and B is the line of identity (observed=predicted)