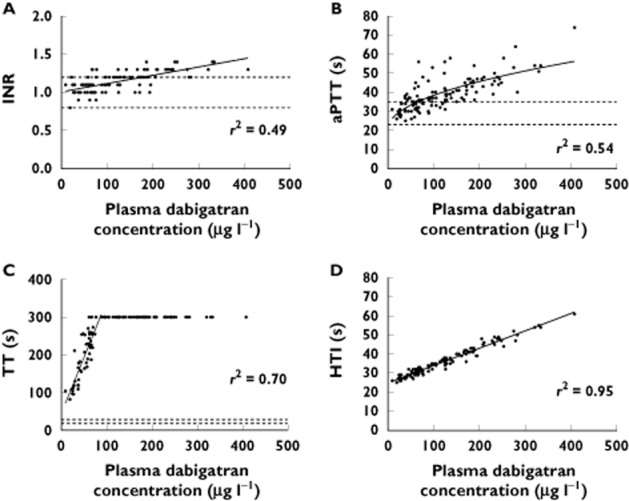
Figure 1.

Correlation plots for 120 samples of international normalized ratio (INR; A), activated partial thromboplastin time (aPTT; B), thrombin time (TT; C) and Hemoclot® Thrombin Inhibitor (HTI; D) against plasma dabigatran concentrations. For TT, all values of TT >300 s have been set to 300 s. Continuous lines represent the lines of best fit. Dashed lines for (A), (B) and (C) are the references ranges at Canterbury Health Laboratories. The r2 values are for the line of best fit, which for (C) does not include those data with TT > 300 s in the linear regression
