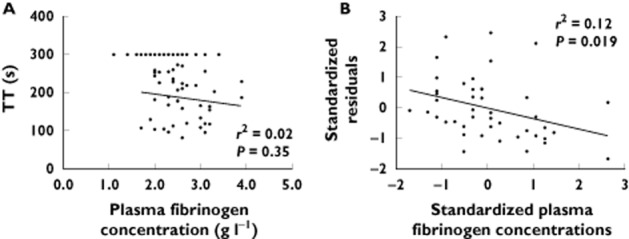
Figure 2.

(A) Correlation plot of plasma fibrinogen concentrations against thrombin time (TT; for 120 samples, TT > 300 s have been set to 300 s). (B) Correlation plot of standardized residuals (from the linear regression of plasma dabigatran concentrations against TT) against standardized plasma fibrinogen concentrations (z-scores, for 45 samples with TT < 300 s). Lines of best fit are determined using the 45 samples with TT <300 s. The r2 values are for the line of best fit, and P values are for the hypothesis that the slope of the linear regression is not zero
